STOCKS ROCKS Trade Smarter
- Simplicity: Momentum trading is a simple and easy with MOMOS
- Detects Stocks before they explode.
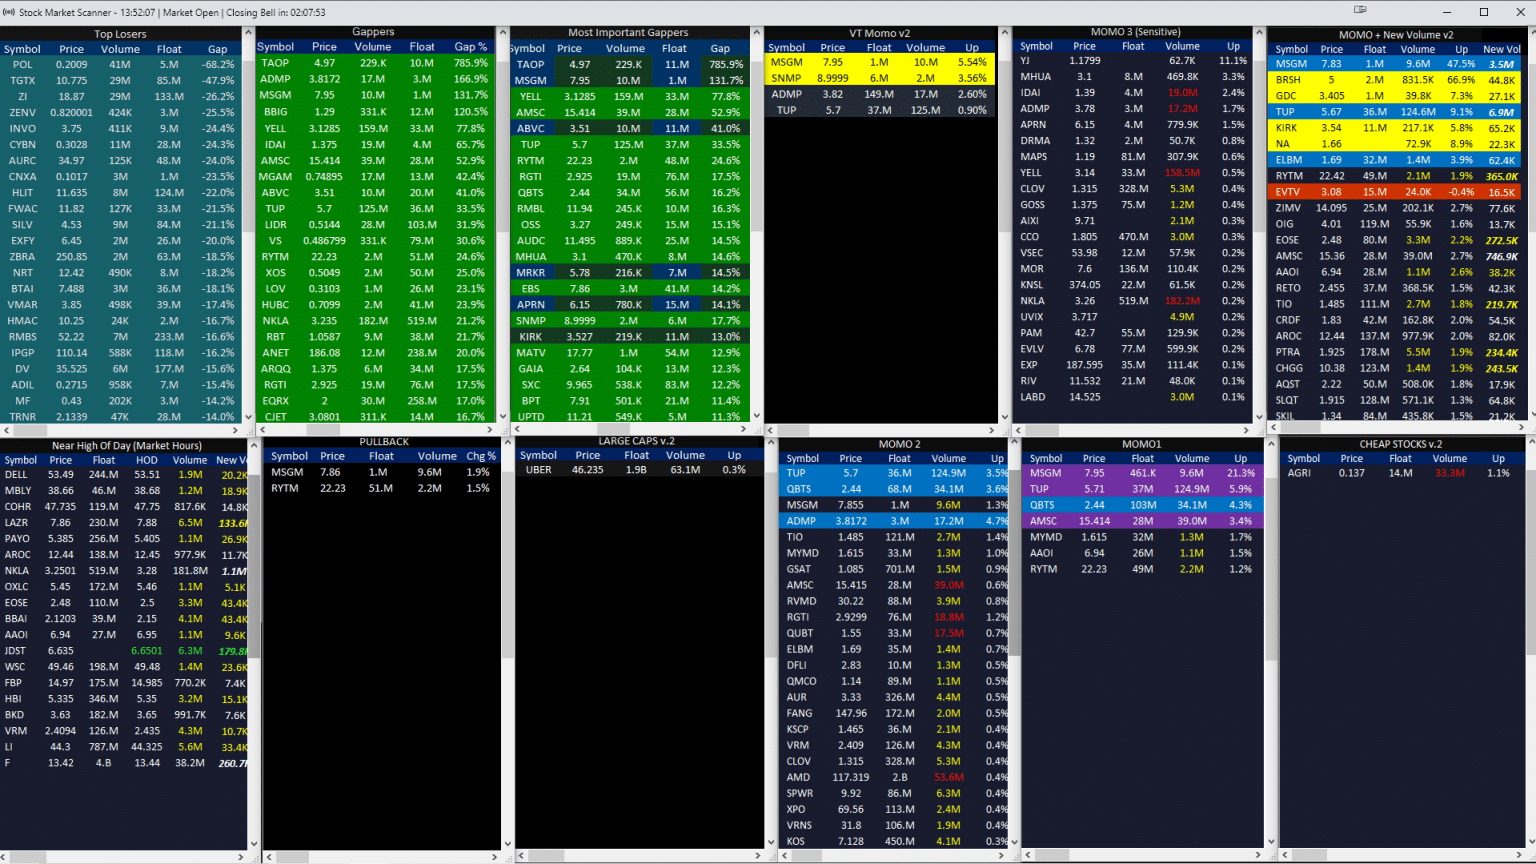
The Prime Spot for Momentum Day Traders
Join our daily live day trading chat room, and learn the best trading strategies to maximize your revenue. Learn to act swiftly and get creative with market alerts, so you can become a successful day trader and live on your own rules.
Why MOMOS
Day trading can be a fast-paced and demanding endeavor, which is why it’s important for traders to have tools that can help them make quick and accurate decisions. It’s a customized stock scanner that is specifically designed to help day traders find momentum stocks with minimal effort.
One of the best things about MOMOS is that it takes the guesswork out of setting filters. Instead of spending hours trying to find the best settings, MOMOS comes pre-configured with the best settings available today, saving traders valuable time. This means that traders can focus on what they do best – day trading – and not waste time fiddling with filters.
MOMOS also provides real-time data, so traders can stay on top of market movements and make decisions quickly. The scanner is designed to identify stocks that are experiencing a strong upswing in momentum, and it will highlight these stocks with a yellow background, making them easy to spot among the thousands of other stocks. This feature is especially useful for day traders who are looking to capitalize on short-term price movements.
In addition to momentum stocks, MOMOS can also help traders find stocks that have recently broken out of a consolidation pattern or have formed a bullish chart pattern. These stocks have a higher likelihood of continuing to move in the same direction and can provide excellent trading opportunities.
It’s important to note that MOMOS is a great tool and should not be relied upon exclusively for making investment decisions. Traders should always conduct their own research and analysis before making any trades. But MOMOS can be a valuable addition to any day trader’s toolbox, helping them make informed and profitable trades with minimal effort.
MOMO 1
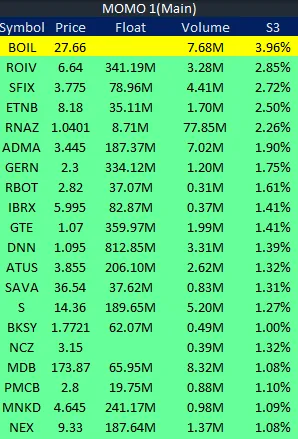
Is designed to help traders to identify stocks with strong momentum. This scanner filters through a large number of stocks that are displayed on other scanners, and focuses on those that have high trading volume and a significant increase in relative volume.
The relative volume increase is also an important factor to consider. This is a measure of how much the trading volume for a stock has increased in comparison to the stock’s average trading volume.
A significant increase in relative volume can indicate that there is a lot of buying activity taking place for a stock, which can be a sign that the stock’s price is about to rise.
Efficiency
MOMO 2
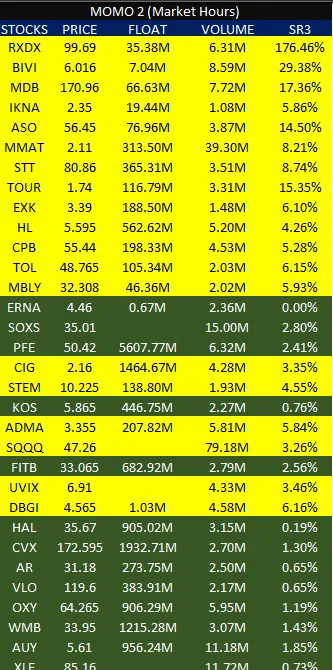
MOMO 2 takes trading volume as a major criteria in its scanner. It uses this criteria to filter through stocks and identify those that have a high level of buying and selling activity .
MOMO 2 Is most effective during market hours, from 9:30 am to 4:00 pm. This is the time when the stock market is open, and the most trading activity is taking place. By using MOMO during these hours, traders can be sure that they are getting the most up-to-date and accurate information about momentum stocks.
Efficiency
MOMO 3
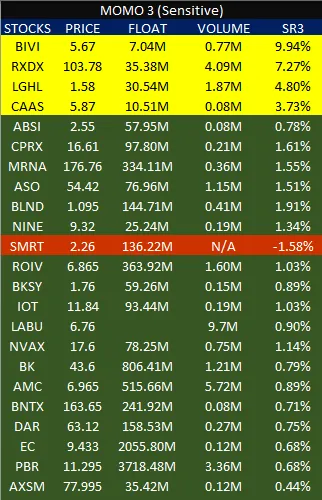
Is powerful scanner for traders looking to identify potential momentum in stocks. It is highly sensitive to stock movements and can detect potential opportunities for gains.
One of the key factors to consider when using MOMO 3 is the float of a stock. Low float stocks can be more volatile and can gap up quickly, making them potentially more attractive for traders.
Please note stocks with a yellow background, indicating that they may have more potential for upside momentum. This is a useful tool for traders looking to identify stocks that may be on the verge of breaking out.
We highly value stocks with a minimum of 300,000 trading volume in pre-market and 1 million volume by the market open at 9:00 am. High trading volume can indicate strong investor interest in a stock and can be an indication of potential momentum or liquidity in the stock. Stocks with high trading volume can be more attractive to traders as they can be more easily bought and sold, and have a higher chance of volatility which can be beneficial for trading.
Efficiency
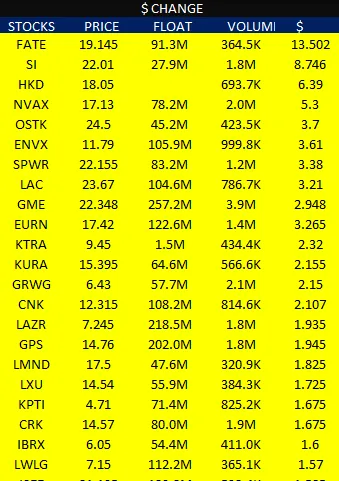
MOMO 4
Is a specialized scanner that utilizes advanced algorithms to identify stocks that are experiencing significant price movement within a specific dollar amount range defined by the user. The scanner is designed to help investors pinpoint stocks that are experiencing substantial price changes in a short period of time.
The use of high-level algorithms in MOMO 4 enables the scanner to analyze vast amounts of market data and filter out stocks that do not meet the specific dollar amount criteria was set .
This allows traders to quickly and easily identify stocks that are experiencing significant price changes and have the potential for high returns.
Efficiency
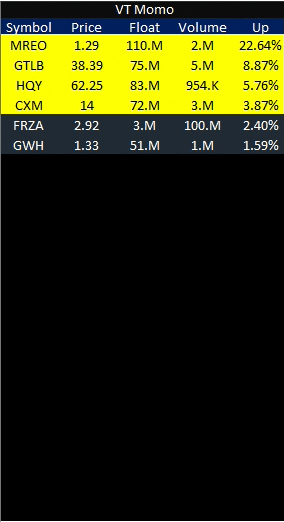
VT MOMO
The VT MOMO scanner is specifically designed to identify stocks that exhibit a surge in price accompanied by a substantial trading volume, filtering out stocks with low trading activity. By focusing on both momentum and volume, this scanner enables traders and investors to pinpoint stocks that demonstrate strong upward momentum and have a significant level of market participation. By considering the interplay between price movement and trading volume, the VT MOMO scanner helps users identify stocks that exhibit a robust surge in price with substantial liquidity, indicating a higher probability of sustained momentum.
Efficiency
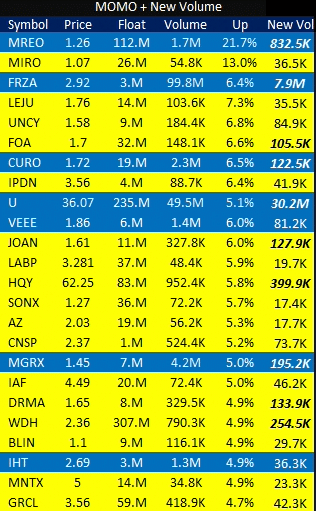
MOMO + NEW VOLUME
The special MOMO NEW volume scanner is like a super cool tool for finding stocks that are really moving fast and have lots of traders buying or selling them. It also shows how much trading volume happened in the most recent time period and puts that information in New Volume column. This helps you see which stocks are getting a lot of attention and how much action is happening with them. So, when you’re looking for exciting stocks to watch, this scanner can give you all the cool details about their momentum and volume in an easy-to-understand way!
Efficiency
NEAR HIGH OF DAY
The Near High of Day scanner operates from market open at 9:30 am EST until 4:00 pm EST, keeping track of stocks that are approaching their highest price of the day. It provides valuable information on the volume detected during the latest update. This scanner helps you identify stocks that are potentially reaching significant price levels and displays the corresponding volume data, indicating the level of market activity. By using this scanner, you can stay informed about stocks that are trending near their daily highs and gain insights into the trading volume associated with those price levels.
Efficiency
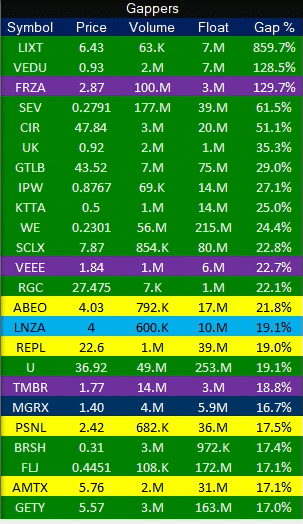
GAPPERS
The Gappers Scanner is an amazing tool that helps traders discover stocks that have made big price jumps in just one day. It looks at the percentage of gains and selects stocks with the highest increases. But here’s the really cool part: if a stock is highlighted in Purple, it means it has a high trading volume and only a limited number of shares available. This is something to pay extra attention to because it can be super exciting for traders. Stocks with low float can change in price really quickly, and when there’s high trading volume, it means lots of people are interested in buying or selling them. This combination creates great opportunities for traders to make some gains. Oh, and don’t forget to also keep an eye on stocks highlighted in Yellow and Blue backgrounds after Purple. With the Gappers Scanner, you can easily find stocks that have surged in price and might be awesome opportunities for trading!
Efficiency
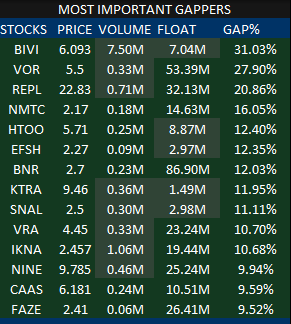
Most Important Gainers
The most important gainers show a short list of stocks that have the potential to reach new highs during the trading day. These stocks have had a significant increase in price and are considered to be performing well in the short term. By focusing on these gainers, traders and investors may be able to identify opportunities for quick returns.
Efficiency
Top Losers
The Losers Scanner is a scanner that displays stocks that have experienced the greatest losses on a given day, sorted by the highest percentage of loss. This allows traders to quickly identify and track stocks that have experienced significant declines, providing an opportunity to analyze and potentially make informed trading decisions.
Efficiency

LARGE CAPS NEAR 52 WEEKS HIGH
This scanner looks of large companies that are trading near their 52-week high price. Which indicates that the stock has been performing well and has been experiencing upward momentum in its price. This can be a sign that the stock has strong fundamentals and has the potential to continue to rise in value. Additionally, a stock that is trading near its 52-week high can also indicate that it is overbought and the price may be due for a pullback, so it’s important to do a fundamental and technical analysis before making any trading or investment decision.
Efficiency

LARGE CAPS NEAR 52 WEEKS LOW
The Large Caps Near 52 Week Low scanner is a powerful scanner that allows traders to easily identify stocks that may be approaching their one-year low levels.
The stocks that are approaching their one-year low levels may be undervalued and have the potential to rebound in the future. By analyzing the stock’s fundamentals, technical analysis, market trends, and other factors, traders can decide whether to buy these stocks for the long term or short them.
Please note that stocks displayed with a yellow background in this scanner indicate those that have already broken out of their one-year range.
Efficiency

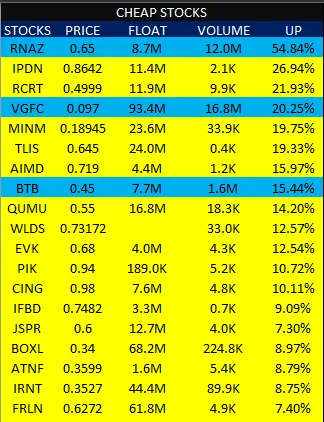
CHEAP STOCKS
The Cheap Stocks Scanner is an scanner for identifying momentum in stocks priced under $1.
This scanner allows traders to quickly identify potential momentum opportunities and make informed decisions on buying or selling stocks.
Traders should pay attention to the stocks marked with blue background as they have a higher liquidity and volatility which may be good for trading.
Efficiency
PULLBACK
Pullback scanners are specifically designed to identify stocks that experience a decline after a recent surge. These scanners employ algorithms and technical indicators to detect and highlight stocks that exhibit a downward movement following a period of significant price increase. By using pullback scanners, traders and investors can efficiently track and monitor stocks that may be experiencing a temporary retreat or correction after a notable upward movement. This enables them to potentially capitalize on opportunities to buy at lower prices or assess the potential for further downside before considering any investment decisions.
Efficiency

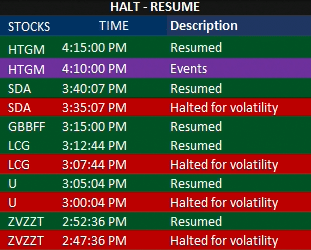
HALT-RESUME
The Halt and Resume scanner is a helpful tool that shows you stocks that have been temporarily halted and later resumed trading. It provides you with the time when the halt occurred, making it easy to track. Halted stocks are displayed with a red background if the halt is due to volatility and a purple background if it’s because of a news event. When a stock resumes trading, it appears with a green background, indicating that it’s available for trading again. This user-friendly scanner keeps you informed about stock halts and resumptions, allowing you to stay updated on market events and potential trading opportunities.
Efficiency
POST MARKET
Post Market Scanners display a list of stocks that have gapped up during the extended trading hours, typically from 4:00 PM EST to market close at 8:00 PM. These stocks are filtered by the highest percentage of gap, allowing traders to quickly and easily identify the most significant gap-ups. This is an important tool for traders looking to capitalize on opportunities in the after-hours market and make informed investment decisions.
Efficiency

Join The VIP list now
Do Not Miss Out: Registration Reopening Soon
We currently offer subscription services only through email waitlist
Disclaimer
MOMOS is a stock scanning tool designed to help traders identify potential trading opportunities. However, it is important to note that the information provided by the tool should not be considered as investment advice or a guarantee of any particular outcome. The tool is intended to be used as a research tool and should be used in conjunction with other research and analysis. We do not guarantee the accuracy or completeness of the information provided by the tool and are not responsible for any errors ,losses or omissions. It is the responsibility of the user to conduct their own research and analysis before making any investment decisions. We do not endorse or recommend any specific securities or investment strategies, and the use of the tool does not constitute a recommendation to buy or sell any particular security. The tool should not be used as the sole basis for any investment decision. It is important to remember that investing in the stock market involves risk, and the value of your investments can go up or down. We are not responsible for any losses that may occur as a result of using the tool or making investment decisions based on the information provided by the tool. Please consult with a financial advisor before making any investment decisions. The use of the tool is subject to the terms and conditions of the agreement between you and us and by using the tool, you acknowledge and accept the risks associated with stock market investing.
